
GPU visualization for Python
VisPy
Fast, interactive scientific visualization in Python.
Create plots, explore large datasets, and build complete scientific applications with open-source tools.
Current statusVisPy is stable.Datoviz 0.4 is available as a release candidate for public testing as the standalone GPU engine and flagship interactive backend for the developing VisPy 2 architecture.VisPy 2 and GSP are still experimental.
NASA Blue Marble Earth rendered as a textured mesh with Datoviz.
Available today
Use VisPy today. Explore what comes next.
Choose VisPy for its stable higher-level Python API, notebooks, and existing applications. Choose Datoviz for modern GPU rendering, large interactive scenes, native integration, or early access to the VisPy 2 rendering direction.
VisPy
The stable, higher-level OpenGL-based Python library for fast, interactive 2D and 3D visualization.
- 13+ years of open-source development
- Established scientific Python community
- Higher-level APIs across desktop and notebooks
Datoviz
The standalone Vulkan-based GPU engine and flagship interactive backend for VisPy 2, now available as a public release candidate.
- Native C and NumPy-aware Python APIs
- Desktop Vulkan and experimental browser WebGPU
- Extensive documentation and 100+ code examples
Renderer-independent by design
Describe a visualization once. Render it where you need it.
Think of the experimental Graphics Server Protocol (GSP) as a common language between scientific Python code and rendering engines. Your code describes points, images, axes, layouts, and interactions. GSP passes that description to Datoviz, Matplotlib, or another backend to draw it.
Read the draft GSP white paperOne scientific graphics stack
From scientific plots to interactive 3D worlds.
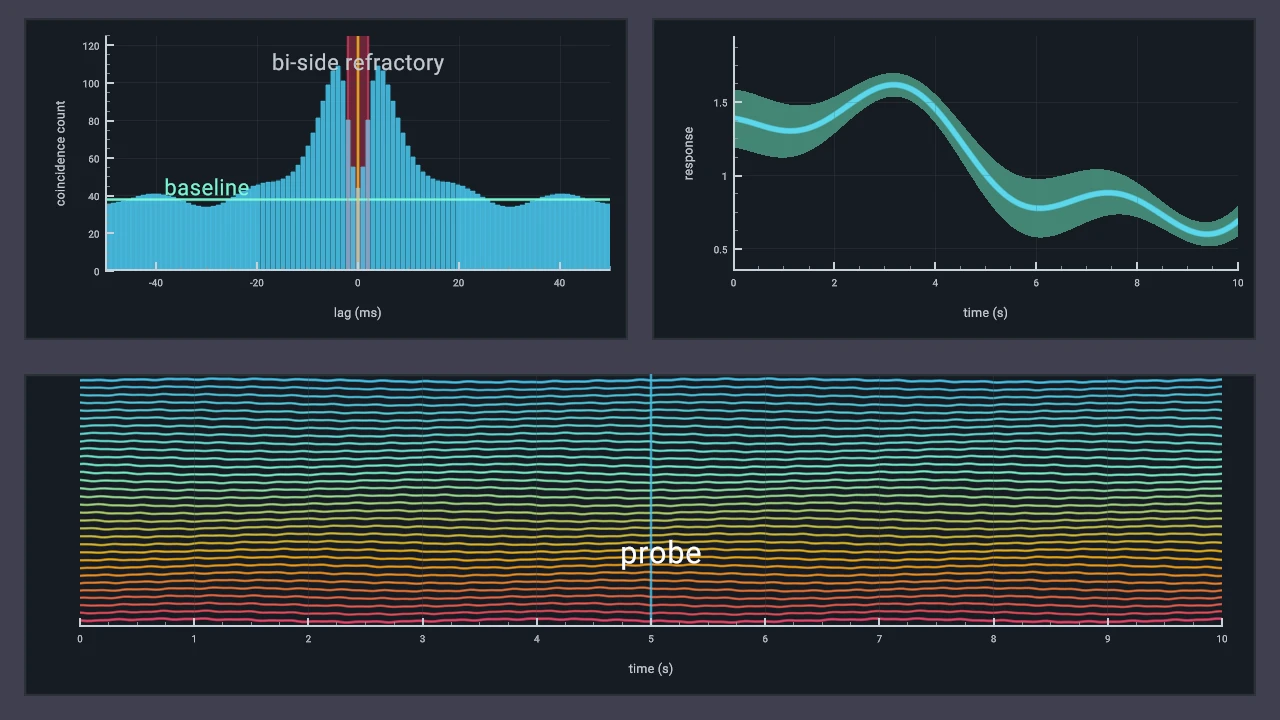
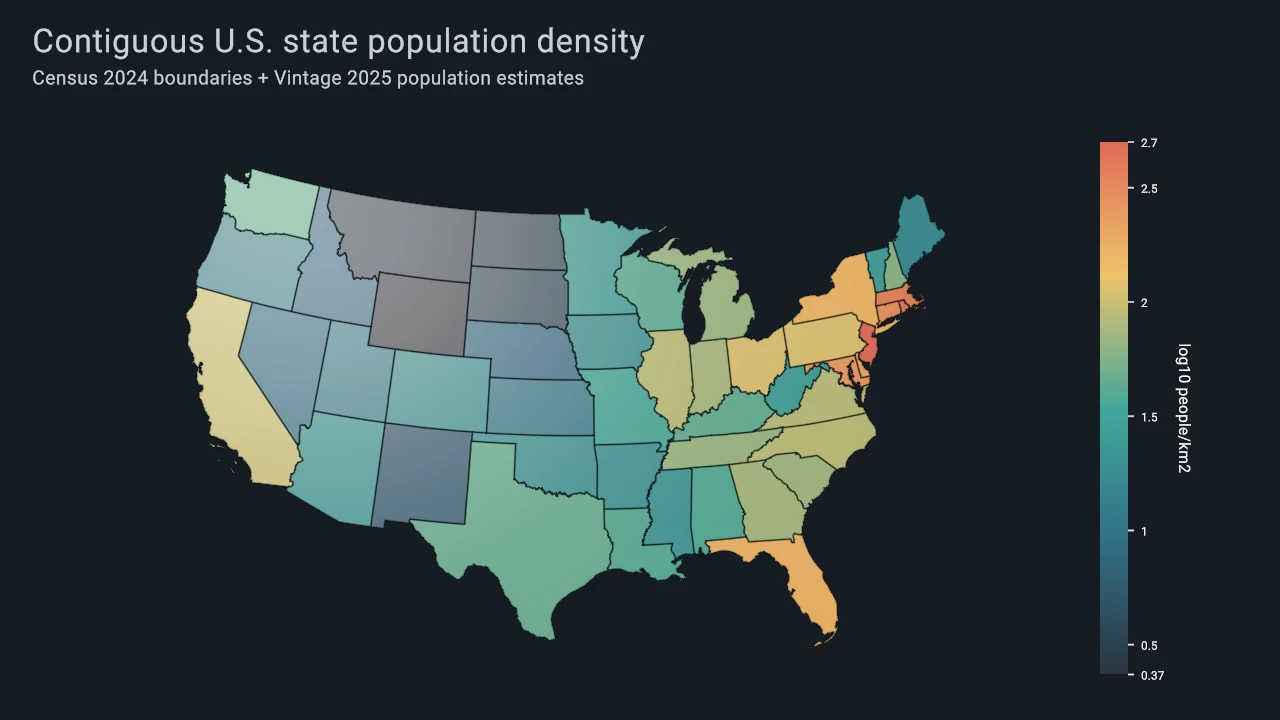
These examples are rendered by Datoviz, the GPU engine planned underneath VisPy 2. They show the same foundations at work in precise plotting, geographic data, physical simulation, and volumetric science.


Built for many fields
Reusable building blocks for specialized science.
Different fields need views and interactions designed for their data. VisPy aims to support community-built components for neuroscience, geoscience, astronomy, microscopy, molecular biology, medical imaging, climate science, engineering, and many other disciplines.
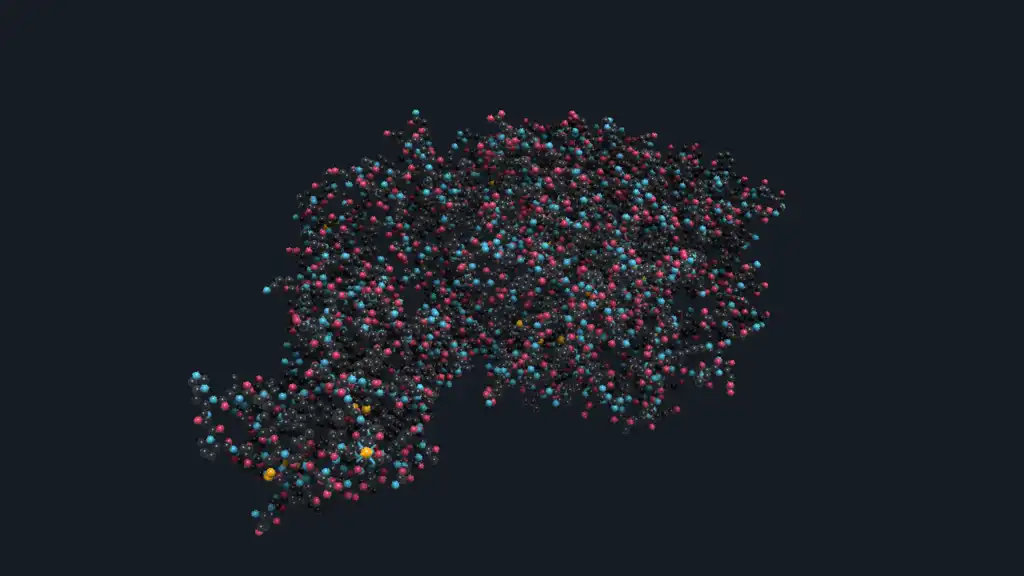 Protein structure rendered with Datoviz
Project status
What is ready—and what is still experimental.
Built on more than a decade of work
Continuity and renewal
Founded in 2013, VisPy grew into a widely used open-source GPU library. Its next chapter keeps that community and experience while adding modern rendering, multiple output formats, and support for complete scientific tools.
VisPy is a NumFOCUS affiliated project. Its development has been supported by the Chan Zuckerberg Initiative and contributors across the scientific Python community.
Participate
Help shape scientific visualization.
We welcome users, backend developers, scientific-tool authors, and domain communities.