
Note
Go to the end to download the full example code.
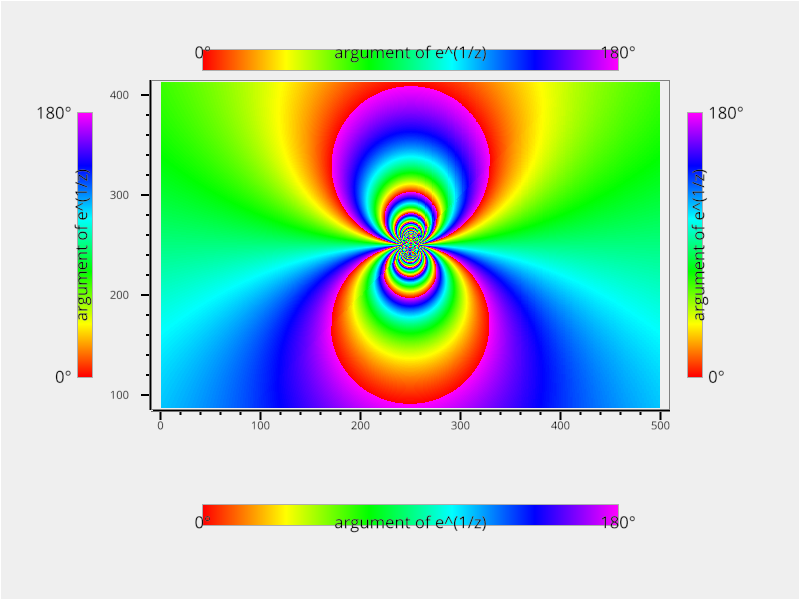
Plot different styles of ColorBar#
from vispy import plot as vp
import numpy as np


# arg( e^(1/z) )
def exp_z_inv(x, y):
    z = complex(x, y)
    f = np.exp(1.0 / z)
    return np.angle(f, deg=True)


# create a 2d grid whose elements are of exp_z_inv
def gen_image(width, height):
    x_vals = np.linspace(-0.5, 0.5, width)
    y_vals = np.linspace(-0.5, 0.5, height)

    grid = np.meshgrid(x_vals, y_vals)
    v_fn = np.vectorize(exp_z_inv)

    return v_fn(*grid).astype(np.float32)

fig = vp.Fig(size=(800, 600), show=False)
plot = fig[0, 0]
plot.bgcolor = "#efefef"

img = gen_image(500, 500)
plot.image(img, cmap="hsl")
plot.camera.set_range((100, 400), (100, 400))

positions = ["top", "bottom", "left", "right"]

for position in positions:
    plot.colorbar(position=position,
                  label="argument of e^(1/z)",
                  clim=("0°", "180°"),
                  cmap="hsl",
                  border_width=1,
                  border_color="#aeaeae")
if __name__ == '__main__':
    fig.show(run=True)
Total running time of the script: (0 minutes 4.306 seconds)