
Note
Go to the end to download the full example code.
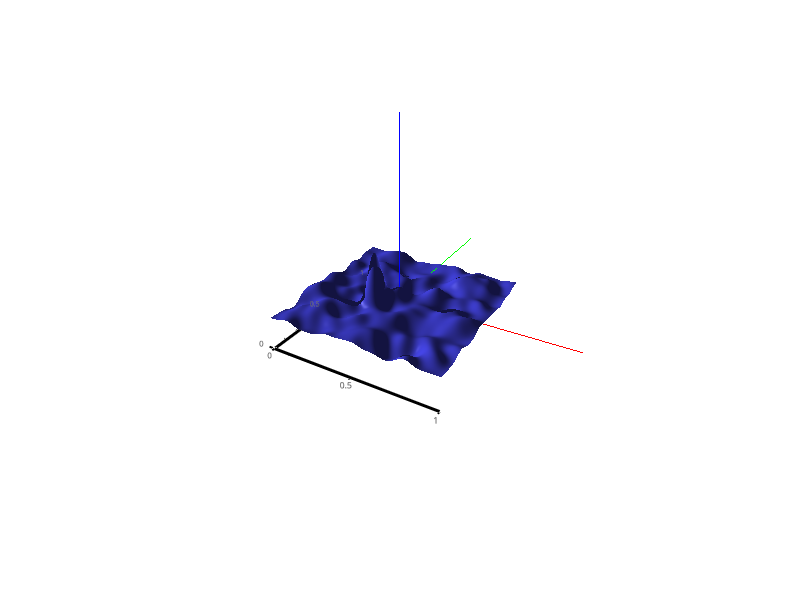
Draw a SurfacePlot#
This example demonstrates the use of the SurfacePlot visual.
import sys
import numpy as np

from vispy import app, scene
from vispy.util.filter import gaussian_filter


canvas = scene.SceneCanvas(keys='interactive', bgcolor='w')
view = canvas.central_widget.add_view()
view.camera = scene.TurntableCamera(up='z', fov=60)

# Simple surface plot example
# x, y values are not specified, so assumed to be 0:50
z = np.random.normal(size=(250, 250), scale=200)
z[100, 100] += 50000
z = gaussian_filter(z, (10, 10))
p1 = scene.visuals.SurfacePlot(z=z, color=(0.3, 0.3, 1, 1))
p1.transform = scene.transforms.MatrixTransform()
p1.transform.scale([1/249., 1/249., 1/249.])
p1.transform.translate([-0.5, -0.5, 0])

view.add(p1)

# p1._update_data()  # cheating.
# cf = scene.filters.ZColormapFilter('fire', zrange=(z.max(), z.min()))
# p1.attach(cf)


xax = scene.Axis(pos=[[-0.5, -0.5], [0.5, -0.5]], tick_direction=(0, -1),
                 font_size=16, axis_color='k', tick_color='k', text_color='k',
                 parent=view.scene)
xax.transform = scene.STTransform(translate=(0, 0, -0.2))

yax = scene.Axis(pos=[[-0.5, -0.5], [-0.5, 0.5]], tick_direction=(-1, 0),
                 font_size=16, axis_color='k', tick_color='k', text_color='k',
                 parent=view.scene)
yax.transform = scene.STTransform(translate=(0, 0, -0.2))

# Add a 3D axis to keep us oriented
axis = scene.visuals.XYZAxis(parent=view.scene)

if __name__ == '__main__':
    canvas.show()
    if sys.flags.interactive == 0:
        app.run()
Total running time of the script: (0 minutes 2.389 seconds)