
Note
Go to the end to download the full example code.
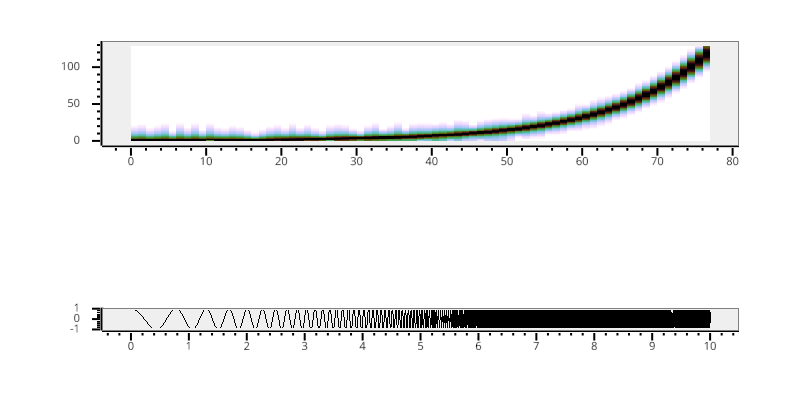
Spectrogram and Line Plot#
A spectrogram and waveform plot of 1D data.
import numpy as np

from vispy import plot as vp

# Create a logarithmic chirp
fs = 1000.
N = 10000
t = np.arange(N) / float(fs)
f0, f1 = 1., 500.
phase = (t[-1] / np.log(f1 / f0)) * f0 * (pow(f1 / f0, t / t[-1]) - 1.0)
data = np.cos(2 * np.pi * phase)

fig = vp.Fig(size=(800, 400), show=False)
fig[0:2, 0].spectrogram(data, fs=fs, clim=(-100, -20))
fig[2, 0].plot(np.array((t, data)).T, marker_size=0)

if __name__ == '__main__':
    fig.show(run=True)
Total running time of the script: (0 minutes 1.629 seconds)