
Note
Go to the end to download the full example code.
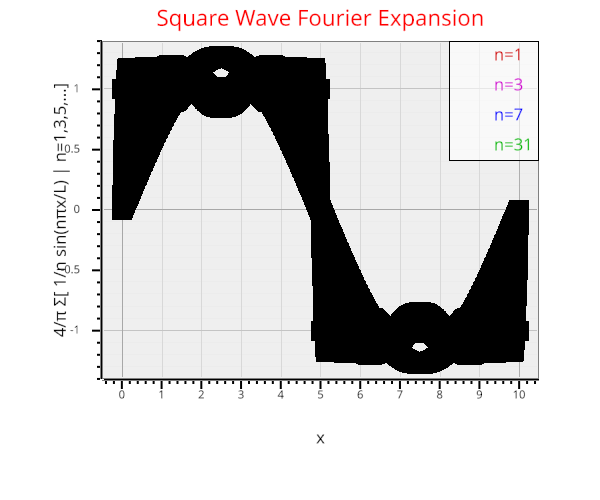
Plot data with different styles#
import numpy as np

from vispy import plot as vp

fig = vp.Fig(size=(600, 500), show=False)

# Plot the target square wave shape
x = np.linspace(0, 10, 1000)
y = np.zeros(1000)
y[1:500] = 1
y[500:-1] = -1
line = fig[0, 0].plot((x, y), width=3, color='k',
                      title='Square Wave Fourier Expansion', xlabel='x',
                      ylabel='4/π Σ[ 1/n sin(nπx/L) | n=1,3,5,...]')

y = np.zeros(1000)
L = 5
colors = [(0.8, 0, 0, 1),
          (0.8, 0, 0.8, 1),
          (0, 0, 1.0, 1),
          (0, 0.7, 0, 1), ]
plot_nvals = [1, 3, 7, 31]
for i in range(16):
    n = i * 2 + 1
    y += (4. / np.pi) * (1. / n) * np.sin(n * np.pi * x / L)
    if n in plot_nvals:
        tmp_line = fig[0, 0].plot((x, y), color=colors[plot_nvals.index(n)],
                                  width=2)
        tmp_line.update_gl_state(depth_test=False)

labelgrid = fig[0, 0].view.add_grid(margin=10)

box = vp.Widget(bgcolor=(1, 1, 1, 0.6), border_color='k')
box_widget = labelgrid.add_widget(box, row=0, col=1)
box_widget.width_max = 90
box_widget.height_max = 120

bottom_spacer = vp.Widget()
labelgrid.add_widget(bottom_spacer, row=1, col=0)

labels = [vp.Label('n=%d' % plot_nvals[i], color=colors[i], anchor_x='left')
          for i in range(len(plot_nvals))]
boxgrid = box.add_grid()
for i, label in enumerate(labels):
    label_widget = boxgrid.add_widget(label, row=i, col=0)


grid = vp.visuals.GridLines(color=(0, 0, 0, 0.5))
grid.set_gl_state('translucent')
fig[0, 0].view.add(grid)


if __name__ == '__main__':
    fig.show(run=True)
Total running time of the script: (0 minutes 3.200 seconds)