
Note
Go to the end to download the full example code.
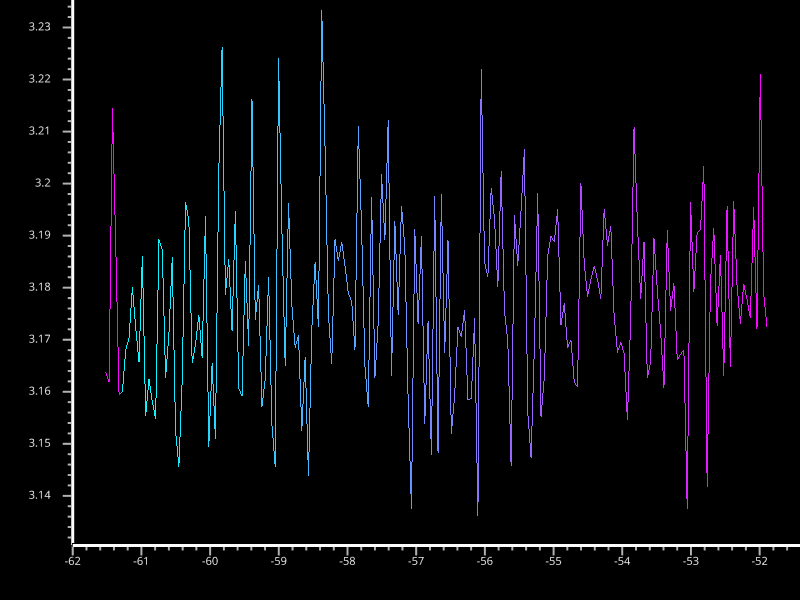
Animated Line Visual#
Demonstration of animated Line visual.
import sys
import numpy as np
from vispy import app, scene

# vertex positions of data to draw
N = 200
pos = np.zeros((N, 2), dtype=np.float32)
x_lim = [50., 750.]
y_lim = [-2., 2.]
pos[:, 0] = np.linspace(x_lim[0], x_lim[1], N)
pos[:, 1] = np.random.normal(size=N)

# color array
color = np.ones((N, 4), dtype=np.float32)
color[:, 0] = np.linspace(0, 1, N)
color[:, 1] = color[::-1, 0]

canvas = scene.SceneCanvas(keys='interactive', show=True)
grid = canvas.central_widget.add_grid(spacing=0)

viewbox = grid.add_view(row=0, col=1, camera='panzoom')

# add some axes
x_axis = scene.AxisWidget(orientation='bottom')
x_axis.stretch = (1, 0.1)
grid.add_widget(x_axis, row=1, col=1)
x_axis.link_view(viewbox)
y_axis = scene.AxisWidget(orientation='left')
y_axis.stretch = (0.1, 1)
grid.add_widget(y_axis, row=0, col=0)
y_axis.link_view(viewbox)

# add a line plot inside the viewbox
line = scene.Line(pos, color, parent=viewbox.scene)

# auto-scale to see the whole line.
viewbox.camera.set_range()


def update(ev):
    global pos, color, line
    pos[:, 1] = np.random.normal(size=N)
    color = np.roll(color, 1, axis=0)
    line.set_data(pos=pos, color=color)

timer = app.Timer()
timer.connect(update)
timer.start(0)

if __name__ == '__main__' and sys.flags.interactive == 0:
    app.run()
Total running time of the script: (0 minutes 0.785 seconds)