Ctrl+K
VisPy - Home VisPy - Home
  • Installation
  • Getting Started
  • Documentation
  • Gallery
  • API
  • News
  • Code of Conduct
  • GitHub
  • Twitter
  • Installation
  • Getting Started
  • Documentation
  • Gallery
  • API
  • News
  • Code of Conduct
  • GitHub
  • Twitter

Section Navigation

  • Gloo
    • Show an Image
    • Animate an Image
    • Animate a Shape
    • Show a rotating colored cube
    • Draw many colored cubes using instanced rendering
    • Show color quad Image
    • Draw a bunch of lines
    • Draw 2D points
    • Draw a Quad
    • Use a Geometry Shader
    • Animate a 2D function
    • Use FrameBuffers
    • Show a rotating cube with lighting
    • Use multiple textures
    • Show a rotating cube with an outline
    • Show post-processing using a FrameBuffer
    • Draw 3D rotating Cube
    • Rotating Quad
    • Spatial Filtering
    • Simplest Possible Script
    • Simplest Shader Program
    • Example using texture internalformat for higher precision
    • Show a rotating textured cube
    • Show a textured quad
  • Scene
    • Simple Line with Axis
    • Demonstration of borders and background colors
    • Clipping planes with volume and markers
    • Display a ColorBar
    • Changing Line Colors
    • Complex image data
    • Vispy Console
    • Apply Contour Filter on an Image
    • Picking Faces from a Mesh
    • Aspect Ratios
    • Visualize NetworkX Graph
    • Display an Image
    • Custom image sampling
    • Draw an InfiniteLine
    • Instanced rendering of arbitrarily transformed meshes
    • Picking Instance of InstancedMeshes
    • Instanced Mesh Visual
    • Custom Visual for instanced rendering of a colored quad
    • Display an Isocurve
    • Isocurve for Triangular Mesh
    • Isocurve for Triangular Mesh with Qt Interface
    • Update Image and Isocurve Visuals
    • Isosurface Visual
    • Vispy Lasso
    • Draw a Line
    • Animated Line Visual
    • Draw an LinearRegion
    • Zoom in using MagnifyCamera
    • Picking Markers
    • Spheres and Sticks
    • Display Mesh Normals
    • Shading a Mesh
    • Texture Filter on Meshes
    • Nested Viewboxes
    • Share Camera Views
    • Single Scene in Multiple View boxes
    • Create a Point Cloud
    • Shape Visuals
    • Create and Save Animation
    • Zoom Sensitivity
    • Draw and Edit Shapes with Mouse
    • Draw a Sphere
    • Draw a SurfacePlot
    • Text in a Scene and ViewBox
    • Display a Cube
    • ViewBox with Clipping Methods
    • Volume Rendering
    • Rendering Planes through 3D Data
  • Plotting
    • Plot different styles of ColorBar
    • Plot a scaled Image
    • Boilerplate Interactive Plotting Session
    • Plot data with different styles
    • Line plot and colorbar
    • Scatter plot and histograms
    • Spectrogram and Line Plot
    • Multi-view Volume Plot
  • Gallery
  • Plotting

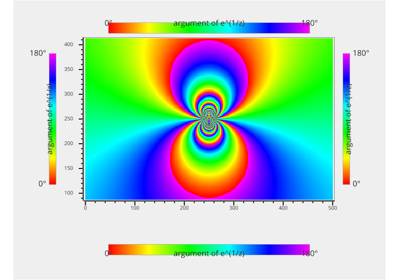
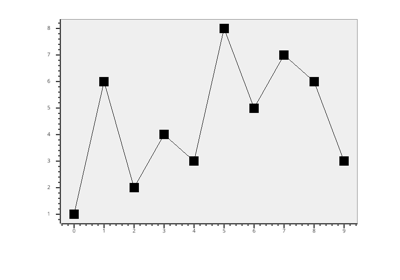
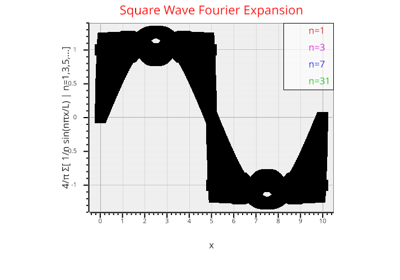
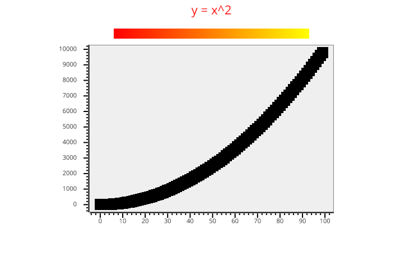
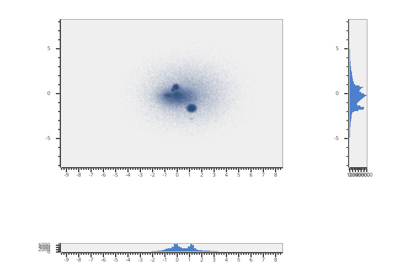
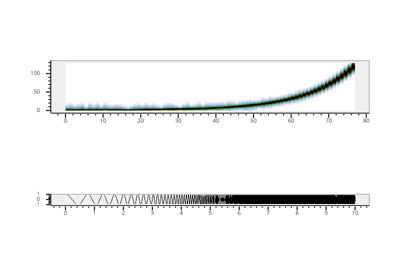
Plotting#

More example scripts are available in the VisPy repository’s example scripts directory.

Plot different styles of ColorBar

Plot different styles of ColorBar

Plot a scaled Image

Plot a scaled Image

Boilerplate Interactive Plotting Session

Boilerplate Interactive Plotting Session

Plot data with different styles

Plot data with different styles

Line plot and colorbar

Line plot and colorbar

Scatter plot and histograms

Scatter plot and histograms

Spectrogram and Line Plot

Spectrogram and Line Plot

Multi-view Volume Plot

Multi-view Volume Plot

Download all examples in Python source code: plotting_python.zip

Download all examples in Jupyter notebooks: plotting_jupyter.zip

Gallery generated by Sphinx-Gallery

previous

Update data using timer events in a background thread

next

Plot different styles of ColorBar

Edit

This Page

  • Show Source

© Copyright 2013-2025, VisPy developers.

Created using Sphinx 7.4.7.

Built with the PyData Sphinx Theme 0.16.1.