
Note
Go to the end to download the full example code.
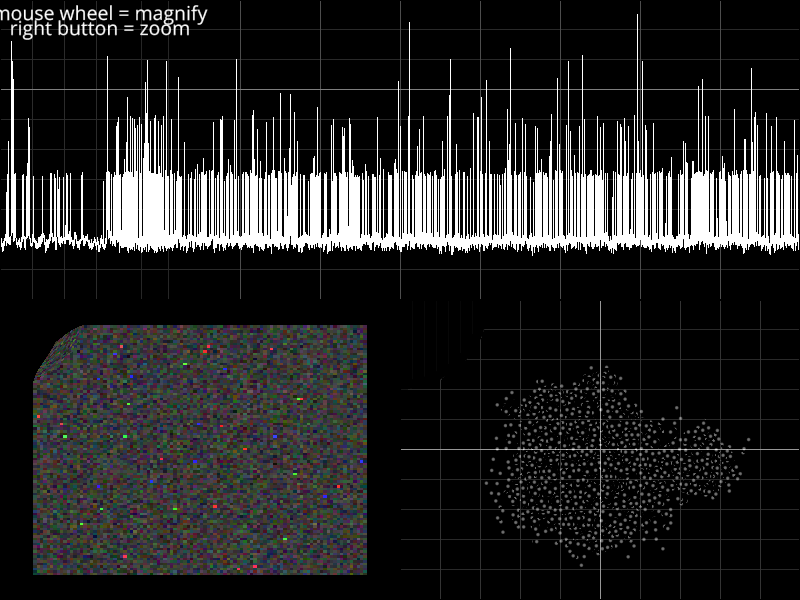
Zoom in using MagnifyCamera#
Demonstrates use of special Camera subclasses to implement a (flashy) data-exploration tool.
Here we use MagnifyCamera to allow the user to zoom in on a particular region of data, while also keeping the entire data set visible for reference.
The MagnifyCamera classes are responsible for inserting MagnifyTransform at the transform of each viewbox scene, while also updating those transforms to respond to user input.
import numpy as np
import vispy.scene
from vispy.scene import visuals
from vispy.scene.cameras import MagnifyCamera, Magnify1DCamera
from vispy.visuals.transforms import STTransform
from vispy.util import filter

#
# Make a canvas and partition it into 3 viewboxes.
#
canvas = vispy.scene.SceneCanvas(keys='interactive', show=True)
canvas._send_hover_events = True  # temporary workaround
grid = canvas.central_widget.add_grid()

vb1 = grid.add_view(row=0, col=0, col_span=2)
vb2 = grid.add_view(row=1, col=0)
vb3 = grid.add_view(row=1, col=1)

#
# Top viewbox: Show a plot line containing fine structure with a 1D
# magnification transform.
#


pos = np.empty((100000, 2))
pos[:, 0] = np.arange(100000)
pos[:, 1] = np.random.normal(size=100000, loc=50, scale=10)
pos[:, 1] = filter.gaussian_filter(pos[:, 1], 20)
pos[:, 1] += np.random.normal(size=100000, loc=0, scale=2)
pos[:, 1][pos[:, 1] > 55] += 100
pos[:, 1] = filter.gaussian_filter(pos[:, 1], 2)
line = visuals.Line(pos, color='white', parent=vb1.scene)
line.transform = STTransform(translate=(0, 0, -0.1))

grid1 = visuals.GridLines(parent=vb1.scene)

vb1.camera = Magnify1DCamera(mag=4, size_factor=0.6, radius_ratio=0.6)
vb1.camera.rect = 0, 30, 100000, 100

#
# Bottom-left viewbox: Image with circular magnification lens.
#
size = (100, 100)

img_data = np.random.normal(size=size+(3,), loc=58, scale=20).astype(np.ubyte)
image = visuals.Image(img_data, parent=vb2.scene, method='impostor')
vb2.camera = MagnifyCamera(mag=3, size_factor=0.3, radius_ratio=0.6)
vb2.camera.rect = (-10, -10, size[0]+20, size[1]+20)

#
# Bottom-right viewbox: Scatter plot with many clusters of varying scale.
#


centers = np.random.normal(size=(50, 2))
pos = np.random.normal(size=(100000, 2), scale=0.2)
indexes = np.random.normal(size=100000, loc=centers.shape[0]/2.,
                           scale=centers.shape[0]/3.)
indexes = np.clip(indexes, 0, centers.shape[0]-1).astype(int)
scales = 10**(np.linspace(-2, 0.5, centers.shape[0]))[indexes][:, np.newaxis]
pos *= scales
pos += centers[indexes]

scatter = visuals.Markers()
scatter.set_data(pos, edge_color=None, face_color=(1, 1, 1, 0.3), size=5)
vb3.add(scatter)

grid2 = visuals.GridLines(parent=vb3.scene)
vb3.camera = MagnifyCamera(mag=3, size_factor=0.3, radius_ratio=0.9)
vb3.camera.rect = (-5, -5, 10, 10)

# Add helpful text
text1 = visuals.Text("mouse wheel = magnify", pos=(100, 15), font_size=14,
                     color='white', parent=canvas.scene)
text2 = visuals.Text("right button = zoom", pos=(100, 30), font_size=14,
                     color='white', parent=canvas.scene)


if __name__ == '__main__':
    import sys
    if sys.flags.interactive != 1:
        vispy.app.run()
Total running time of the script: (0 minutes 3.231 seconds)