
Note
Go to the end to download the full example code.
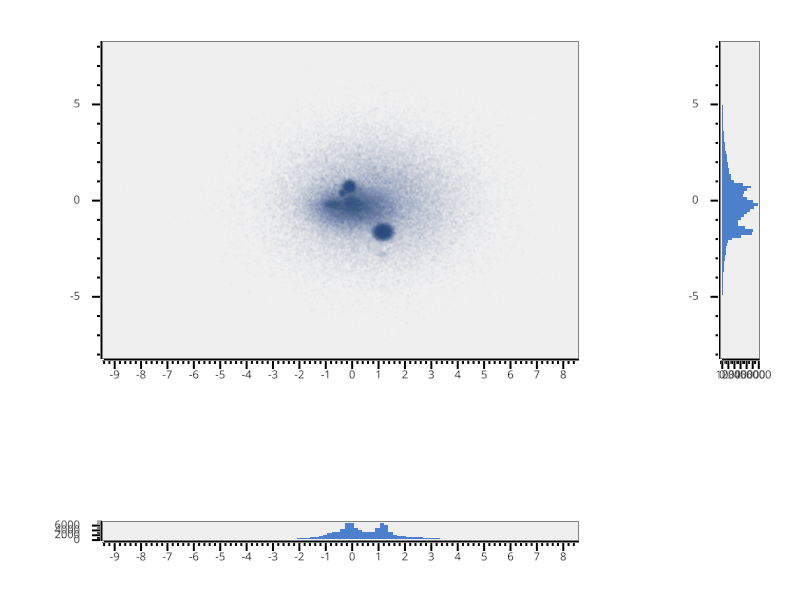
Scatter plot and histograms#
A scatter plot of 2D points with matching histograms.
import numpy as np

import vispy.plot as vp

np.random.seed(2324)
n = 100000
data = np.empty((n, 2))
lasti = 0
for i in range(1, 20):
    nexti = lasti + (n - lasti) // 2
    scale = np.abs(np.random.randn(2)) + 0.1
    scale[1] = scale.mean()
    data[lasti:nexti] = np.random.normal(size=(nexti-lasti, 2),
                                         loc=np.random.randn(2),
                                         scale=scale / i)
    lasti = nexti
data = data[:lasti]


color = (0.3, 0.5, 0.8)
n_bins = 100

fig = vp.Fig(show=False)
line = fig[0:4, 0:4].plot(data, symbol='o', width=0,
                          face_color=color + (0.02,), edge_color=None,
                          marker_size=4)
line.set_gl_state(depth_test=False)
fig[4, 0:4].histogram(data[:, 0], bins=n_bins, color=color, orientation='h')
fig[0:4, 4].histogram(data[:, 1], bins=n_bins, color=color, orientation='v')

if __name__ == '__main__':
    fig.show(run=True)
Total running time of the script: (0 minutes 8.397 seconds)