
Note
Go to the end to download the full example code.
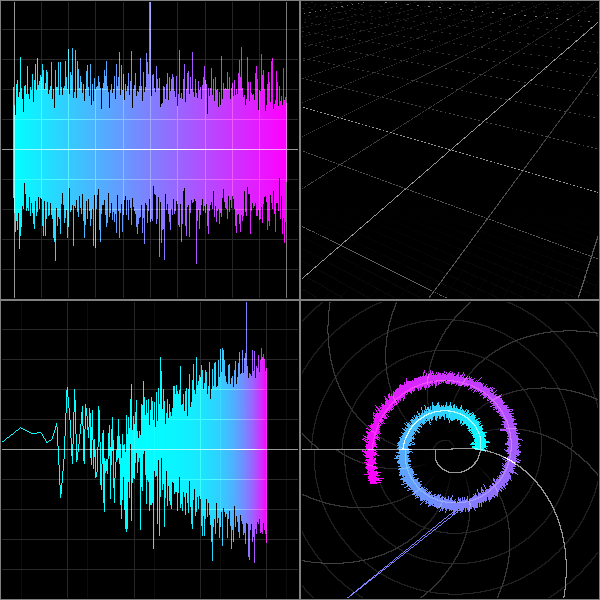
Multiple ViewBoxes on a Grid#
Test automatic layout of multiple viewboxes using Grid.
import sys
import numpy as np

from vispy import scene, app

canvas = scene.SceneCanvas(keys='interactive')
canvas.size = 600, 600
canvas.show()

# This is the top-level widget that will hold three ViewBoxes, which will
# be automatically resized whenever the grid is resized.
grid = canvas.central_widget.add_grid()


# Add 4 ViewBoxes to the grid
b1 = grid.add_view(row=0, col=0)
b1.border_color = (0.5, 0.5, 0.5, 1)
b1.camera = scene.PanZoomCamera(rect=(-0.5, -5, 11, 10))

b2 = grid.add_view(row=0, col=1)
b2.camera = 'turntable'
b2.border_color = (0.5, 0.5, 0.5, 1)

b3 = grid.add_view(row=1, col=0)
b3.border_color = (0.5, 0.5, 0.5, 1)
b3.camera = scene.PanZoomCamera(rect=(-10, -5, 15, 10))

b4 = grid.add_view(row=1, col=1)
b4.border_color = (0.5, 0.5, 0.5, 1)
b4.camera = scene.PanZoomCamera(rect=(-5, -5, 10, 10))


# Generate some random vertex data and a color gradient
N = 10000
pos = np.empty((N, 2), dtype=np.float32)
pos[:, 0] = np.linspace(0, 10, N)
pos[:, 1] = np.random.normal(size=N)
pos[5000, 1] += 50

color = np.ones((N, 4), dtype=np.float32)
color[:, 0] = np.linspace(0, 1, N)
color[:, 1] = color[::-1, 0]

# Top grid cell shows plot data in a rectangular coordinate system.
l1 = scene.visuals.Line(pos=pos, color=color, antialias=False, method='gl')
b1.add(l1)
grid1 = scene.visuals.GridLines(parent=b1.scene)

# Bottom-left grid cell shows the same data with log-transformed X
grid2 = scene.visuals.GridLines(parent=b2.scene)

# Bottom-left grid cell shows the same data with log-transformed X
e2 = scene.Node(parent=b3.scene)
e2.transform = scene.transforms.LogTransform(base=(2, 0, 0))
l2 = scene.visuals.Line(pos=pos, color=color, antialias=False, parent=e2,
                        method='gl')
grid3 = scene.visuals.GridLines(parent=e2)

# Bottom-right grid cell shows the same data again, but with a much more
# interesting transformation.
e3 = scene.Node(parent=b4.scene)
affine = scene.transforms.MatrixTransform()
affine.scale((1, 0.1))
affine.rotate(10, (0, 0, 1))
affine.translate((0, 1))
e3.transform = scene.transforms.ChainTransform([
    scene.transforms.PolarTransform(),
    affine])
l3 = scene.visuals.Line(pos=pos, color=color, antialias=False, parent=e3,
                        method='gl')
grid4 = scene.visuals.GridLines(scale=(np.pi/6., 1.0), parent=e3)

if __name__ == '__main__' and sys.flags.interactive == 0:
    app.run()
Total running time of the script: (0 minutes 1.782 seconds)