Ctrl+K
VisPy - Home VisPy - Home
  • Installation
  • Getting Started
  • Documentation
  • Gallery
  • API
  • News
  • Code of Conduct
  • GitHub
  • Twitter
  • Installation
  • Getting Started
  • Documentation
  • Gallery
  • API
  • News
  • Code of Conduct
  • GitHub
  • Twitter

Section Navigation

  • Gloo
    • Show an Image
    • Animate an Image
    • Animate a Shape
    • Show a rotating colored cube
    • Draw many colored cubes using instanced rendering
    • Show color quad Image
    • Draw a bunch of lines
    • Draw 2D points
    • Draw a Quad
    • Use a Geometry Shader
    • Animate a 2D function
    • Use FrameBuffers
    • Show a rotating cube with lighting
    • Use multiple textures
    • Show a rotating cube with an outline
    • Show post-processing using a FrameBuffer
    • Draw 3D rotating Cube
    • Rotating Quad
    • Spatial Filtering
    • Simplest Possible Script
    • Simplest Shader Program
    • Example using texture internalformat for higher precision
    • Show a rotating textured cube
    • Show a textured quad
  • Scene
    • Simple Line with Axis
    • Demonstration of borders and background colors
    • Clipping planes with volume and markers
    • Display a ColorBar
    • Changing Line Colors
    • Complex image data
    • Vispy Console
    • Apply Contour Filter on an Image
    • Picking Faces from a Mesh
    • Aspect Ratios
    • Visualize NetworkX Graph
    • Display an Image
    • Custom image sampling
    • Draw an InfiniteLine
    • Instanced rendering of arbitrarily transformed meshes
    • Picking Instance of InstancedMeshes
    • Instanced Mesh Visual
    • Custom Visual for instanced rendering of a colored quad
    • Display an Isocurve
    • Isocurve for Triangular Mesh
    • Isocurve for Triangular Mesh with Qt Interface
    • Update Image and Isocurve Visuals
    • Isosurface Visual
    • Vispy Lasso
    • Draw a Line
    • Animated Line Visual
    • Draw an LinearRegion
    • Zoom in using MagnifyCamera
    • Picking Markers
    • Spheres and Sticks
    • Display Mesh Normals
    • Shading a Mesh
    • Texture Filter on Meshes
    • Nested Viewboxes
    • Share Camera Views
    • Single Scene in Multiple View boxes
    • Create a Point Cloud
    • Shape Visuals
    • Create and Save Animation
    • Zoom Sensitivity
    • Draw and Edit Shapes with Mouse
    • Draw a Sphere
    • Draw a SurfacePlot
    • Text in a Scene and ViewBox
    • Display a Cube
    • ViewBox with Clipping Methods
    • Volume Rendering
    • Rendering Planes through 3D Data
  • Plotting
    • Plot different styles of ColorBar
    • Plot a scaled Image
    • Boilerplate Interactive Plotting Session
    • Plot data with different styles
    • Line plot and colorbar
    • Scatter plot and histograms
    • Spectrogram and Line Plot
    • Multi-view Volume Plot
  • Gallery
  • Scene
  • Grid Layouts

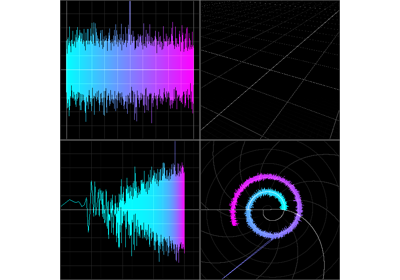
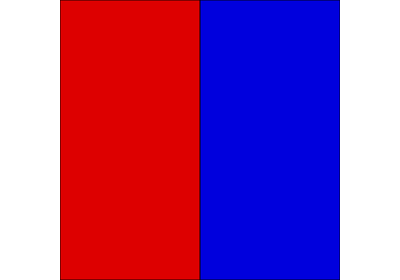
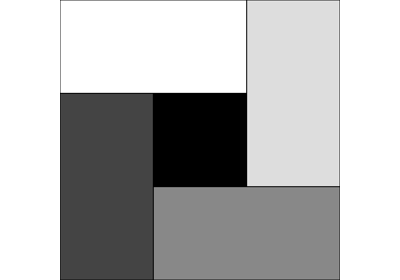
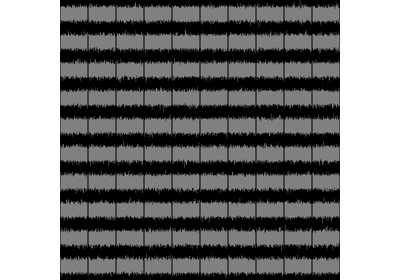
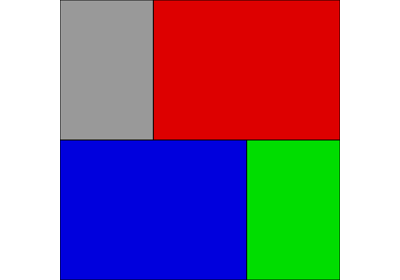
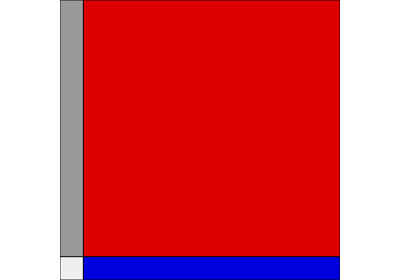
Grid Layouts#

Examples of using the GridWidget to layout elements in a SceneCanvas.

Multiple ViewBoxes on a Grid

Multiple ViewBoxes on a Grid

Simple use of a grid layout

Simple use of a grid layout

More complex grid layout

More complex grid layout

Multiple Line Views on a Grid

Multiple Line Views on a Grid

Another Grid Layout

Another Grid Layout

Plot-like Grid Layout

Plot-like Grid Layout

previous

Rendering Planes through 3D Data

next

Multiple ViewBoxes on a Grid

Edit

This Page

  • Show Source

© Copyright 2013-2025, VisPy developers.

Created using Sphinx 7.4.7.

Built with the PyData Sphinx Theme 0.16.1.